


Does birthday matter for the NHL draft?
One of today's most pressing questions

If you’ve ever read a tweet of mine, there’s a good chance it mentions an NHL prospect’s birth month, or some reference therein. That’s because two research groups have found that, although there are more NHL players born early in the calendar year (January through ~March), the players born later in the year tend to outperform them. I wanted to see if I could replicate the findings.
First thing’s first. Here is a look at the distribution of live births between 1984 and 1997 in Canada, Czechia, Finland, Russia, Sweden, and the U.S., per UN birth data.

It’s pretty even. I picked those years because they correspond with birth years of the 2002-2015 NHL draft classes, which will be my focus. Here is the distribution of birth months from all the players drafted in those classes.
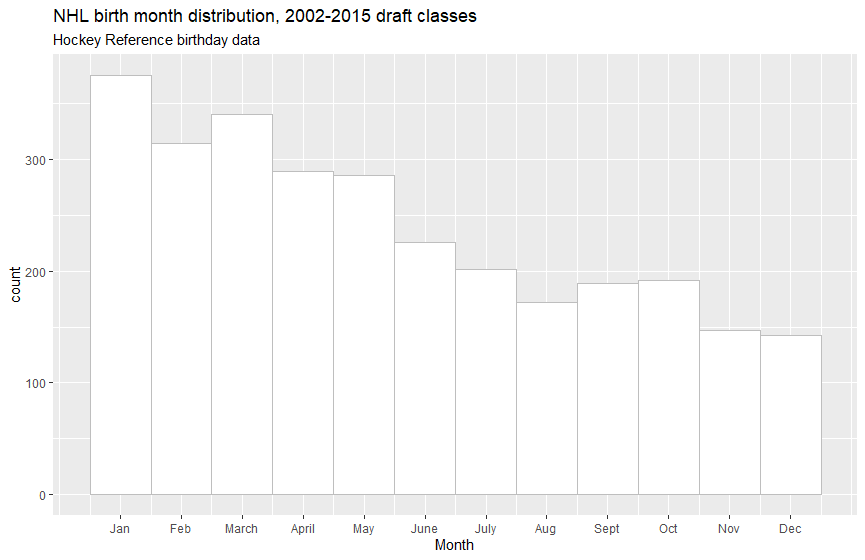
OK. Obviously there’s a huge difference here. If NHL teams drafted players at random, or elite junior programs selected players at random, we’d expect the NHL’s birth-month distribution to look more like that of the UN’s. The argument the papers I linked to make is that the players born in April through December tend to outperform their Jan-March counterparts in career length and impact (typically using points or plus/minus as the performance metric).
I wanted to do the same thing but with Evolving Hockey’s expected goals above replacement (xGAR) metric and games played. To test whether two non-normal sample distributions are statistically different from one another, I’m using the Wilcoxon/Mann-Whitney test. Here’s an example of someone using it to compare distributions of age and socioeconomic data.
To define the performance threshold, I used Patrick Bacon’s Pareto Principle research. About 18% of NHL skaters are responsible for 80% of the goals above replacement generated. Moving forward, a “star” NHLer is someone whose prime-age expected goals above replacement is at or above the 80th percentile threshold.
Let’s compare some distributions
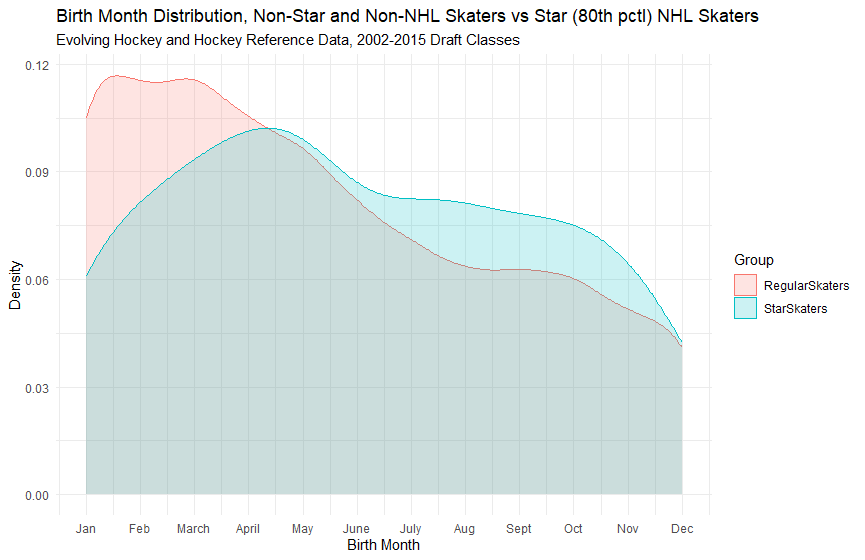
First, I compared the birth-month distribution of all star NHL skaters (goalies not included in my analysis) to the distribution of all the other skaters in my database. Here’s what the frequency plots look like. Clearly, fewer star skaters have January through April birthdays than everyone else.
When I tested the two distributions to see if the difference is statistically significant, I got a p-value of .0025. Great, we can just ignore prospects born in the first quarter or so of the calendar year!
Not exactly.
I broke down the database into positions: centers, wingers, and defensemen. These are the positions currently listed on Hockey Reference. My sample omits guys listed with two positions, like C/LW. But there weren’t too many of them.

The difference between distributions for centers wasn’t statistically significant, despite how different the two plots look.
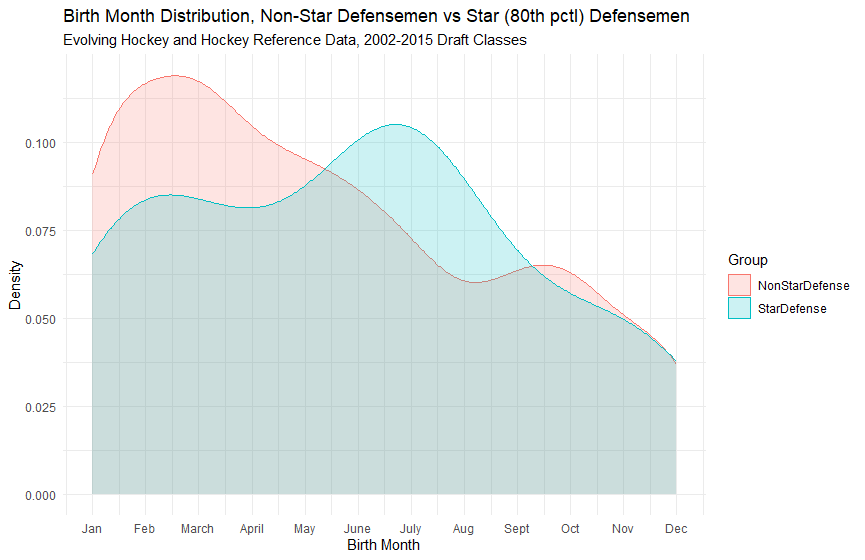
Same thing with defensemen. The difference in birth-month distributions wasn’t statistically significant.
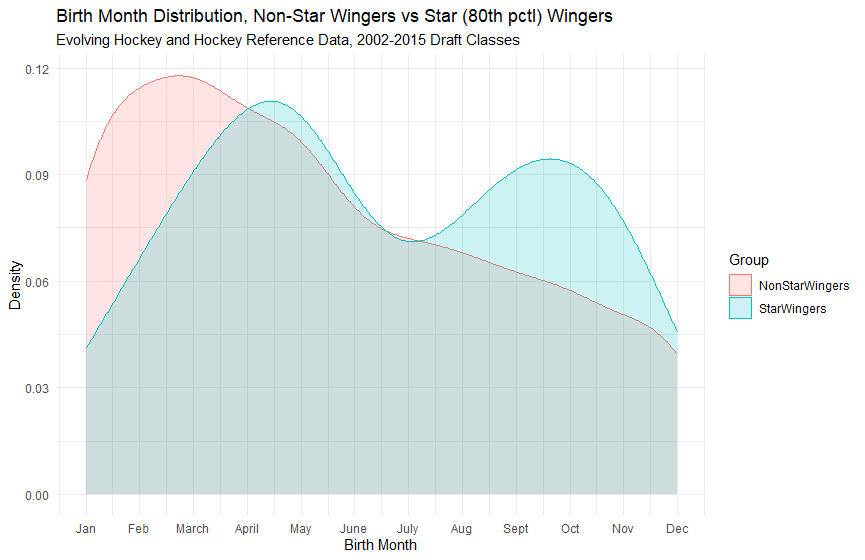
But, here! There is a statistically significant difference between non star wingers and 80th-percentile and above wingers. Perhaps there is some wisdom to selecting wingers born between ~August and December.
What of later picks?
The other thing I wanted to do was check to see if there was any signal with players selected after the NHL ceases to be efficient at ordering draft talent. Here’s a draft-pick curve using all the skaters in my sample.
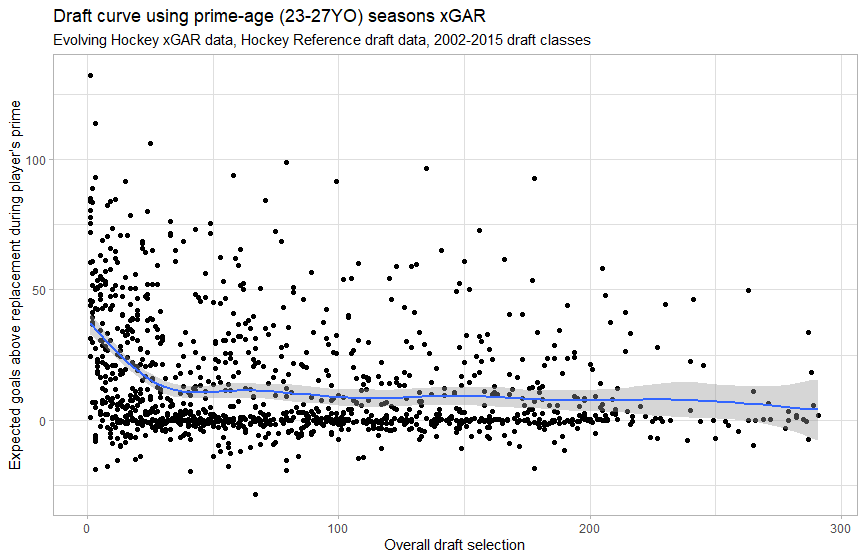
You can see that around pick 40, the relationship between overall selection and player performance dissipates. For my next trick, I’ll evaluate only skaters selected with pick 41 and later.
A major caveat here: whittling down my database makes my sample sizes much smaller.
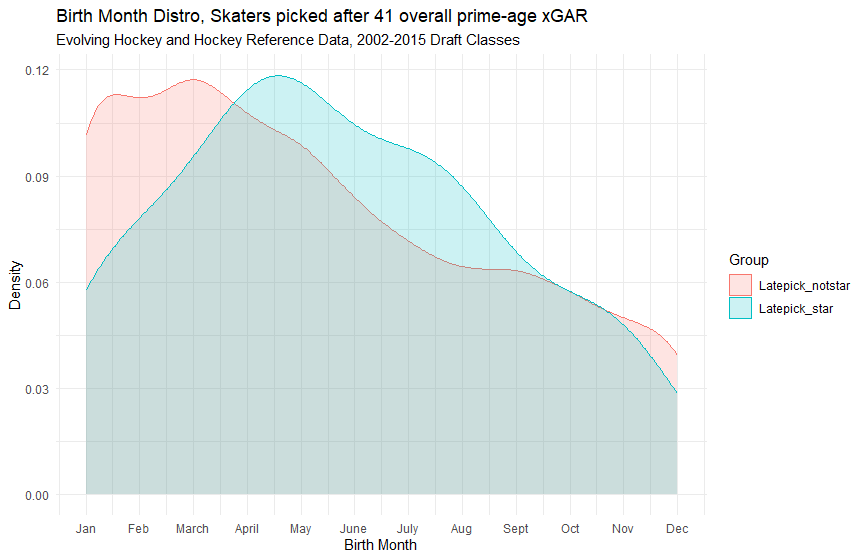
Here are the birth-month distributions of all the skaters in my database. Though they look quite different, a Wilcoxon text returned a p-value of 0.18.
I did the same thing as above and looked at this position by position.
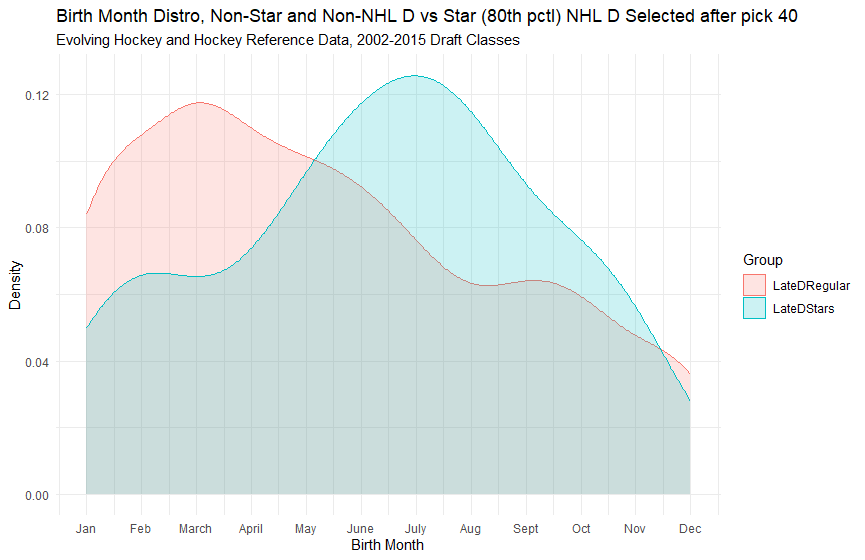
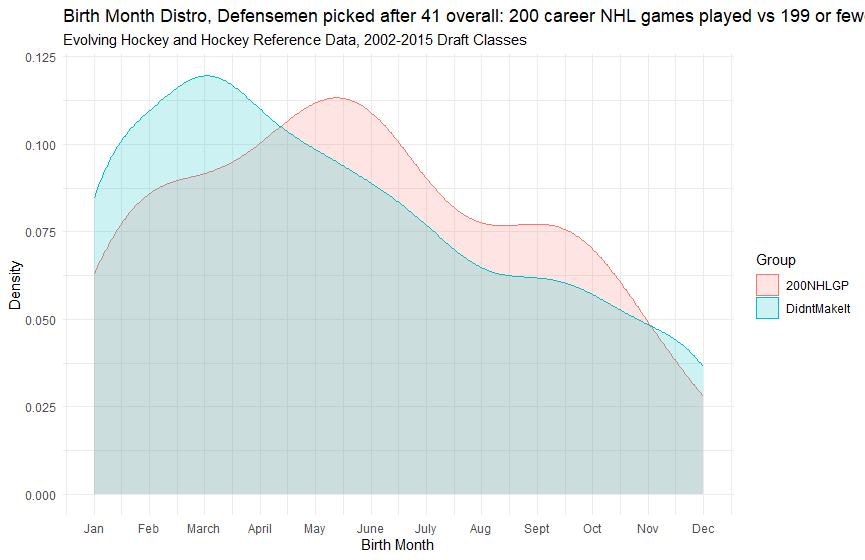
The only position group where there was a statistically significant difference between the stars’ and non-stars birth months was with defensemen. But it was only statistically significant at the p < 0.1 threshold, a 0.089. The p-value for wingers was 0.63 and for centers, 0.90.
If you’re looking at skaters drafted after the first 40-or-so picks, defensemen born between June and ~November might be good bets.
Good old-fashioned games played
Goals above replacement models might not be the best output metric. I call this the Robert Hagg conundrum. Hagg played 260+ NHL games during his prime but recorded a massively negative goals above replacement figure. But, certainly the Flyers were happier to have an NHL for a few seasons than to get nothing from their selection. We’ll use 200 career games played for this threshold, as it’s a common cutoff and represents five seasons averaging 40 games. Forty games accrued in a season takes a player one year closer to unrestricted free agency, so it’s a decent barometer for whether teams are happy with said player.
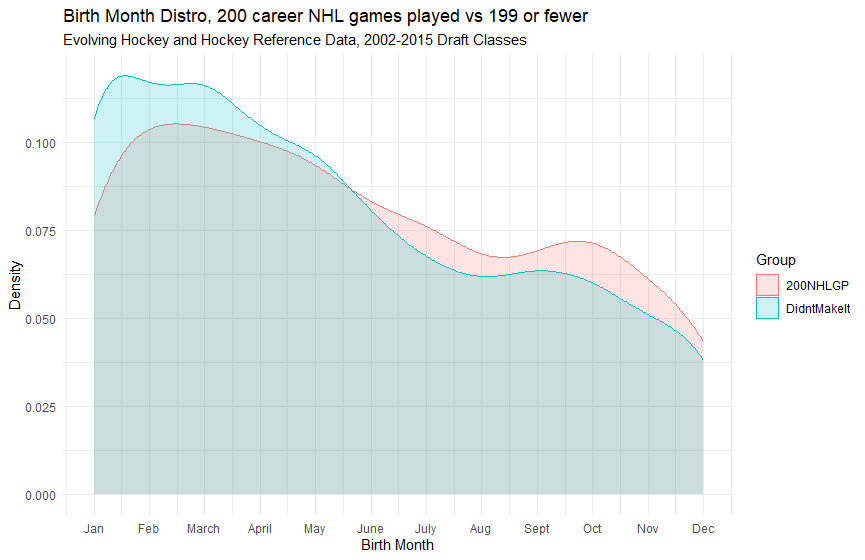
Here are all skaters in my database. You probably don’t even need to run a test to see that the distributions are pretty similar.
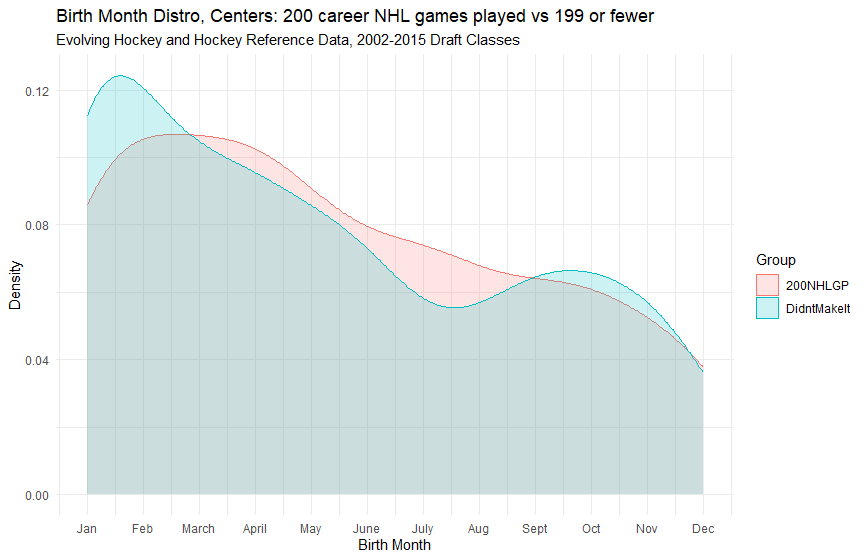
Here are your 200GP centers. The differences between these distributions is not statistically significant. Nor is it for defensemen, below:

Here, again, our friends the wingers shine.

The difference between these distributions is statistically significant, with a p-value of 0.0018. Again we see that when selecting players we think will play wing in the NHL level, the later birthdays might be a good place to spend draft picks.
I did the same thing but just for players picked after the 40th-overall selection. Itty bitty sample sizes, and none of the differences between 200-games-played guys and the rest of their cohorts were statistically significant. Though, again, for defensemen the p-value here was 0.14, so fairly close to being significant at the p < 0.1 threshold.
Can I draft using this info?
I don’t see why not. If we are going to treat p-values capturing the difference between birth month distribution as gospel, then we’d do something like this:
Ignore birthdays for players we think will be centers in the NHL
Focus on wingers who were born in August and later in the calendar year in the first round. After pick ~40, look at wingers who were born after their draft-year cutoff (Sept. 15). We typically consider late birthdays like this a negative, but it appears it’s something to lean into when trying to find impactful wingers. I would probably avoid wingers drafted in January and February.
For defensemen, don’t worry too much about birth month within the first 40 picks. After that, it’s probably a good strategy to overindex on guys born during the summer and early fall and avoid guys born January through April. If you look at the Blackhawks under Kyle Davidson’s influence, you’ll see that nearly all of the team’s defense picks in the later rounds have birthdays in this range.
There are caveats to all this, of course. My small sample sizes and liberal treatment of p-values is probably indicative of results that may not be as robust were we able to expand our sample size. The other thing is that someone born April 30 shouldn’t suddenly be tossed aside for someone born May 1. These are rough guidelines, not hard lines to never cross.
Some players who interest me based on available scouting reports, scoring, birthday, and projected draft slot (not an obvious 1st-round selection) include: